5.Data Analysis
After four weeks' action research, I designed
Questionnaire Two(See Appendix E). The
second questionnaire was partly based
on Questionnaire One in the preliminary
research so that comparisons could be
made to see the improvement. In designing
this new questionnaire, I also used feedback
information from my solutions to the problems
discussed so that their effectiveness
could be reflected by the results. Compared
with the first questionnaire, the second
one had its own features, for by now I
was more conscious of the usefulness of
the oral practice management I suggested.
I especially hoped to know what my students
had gained and which methods they preferred.
The results are listed as follows:
5.1 Students' general impression of the
project
The project here consists of three aspects:
degree of interest, practicality and satisfaction.
After comparing the results of the two
questionnaires, I found out that generally
speaking, there has been significant improvement
after the implementation. The results
of the two questionnaires are presented
in Graph 1 and Table 1.

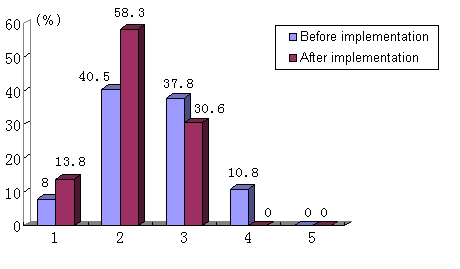
Graph 1: Comparison of degree of interest
Interest:
Graph 1 shows that there is a drastic
improvement in this regard. Most of the
subjects who rank themselves in scale
"Like" and "Like very much"
amount to 72.1%, while the percentage
was only 48.5% before the implementation.
The graph also shows no one dislikes oral
practice after the implementation. As
the objective of our research is to enhance
my students' interest and effect in doing
oral practice after class, such a result
is very encouraging. It proves that our
implementation of the solutions is fruitful
and effective. Yet I should not be too
optimistic, since there are still 37.8
% of the students choosing 3. Though the
number is much smaller than that in Questionnaire
One. This implies that I should find out
some other reasons to account for this
fact, and try to solve the problem more
thoroughly, as can be seen from the following
analysis.
Practicality:
Comparison between the results of the
two questionnaires shows that 100% of
the students think the oral tasks I asked
them to do after class now are more practical
than before. And through practising the
oral tasks, they have much improvement
in the following aspects.
Firstly, 83.3% of them said they had learned
some methods of retelling texts.
Secondly, 86.1% of them said they could
easily learn the new patterns and main
ideas of the texts by heart.
Thirdly, 88.9% of them said they could
express the main idea of the texts or
retell the texts in oral English.
Fourthly, 50% of them said they could
communicate something about the topic
"Seeing the doctor" with their
classmates.
Satisfaction:
Our data also show that 100% of the students
are more satisfied with the oral tasks
I asked them to do after class now than
they were before. I asked them which methods
of the following they were more satisfied
with.
Table 1: Students' preference to methods
dealing with the oral practice
| Methods |
No. of Ss |
Percentage |
| Working in groups |
21 |
58.3 |
| Acting in class |
20 |
55.6 |
| Reciting the shorter passages |
21 |
58.3 |
|
Giving necessary help and directions
|
24 |
66.7 |
| Supplying more topics, models and
materials |
22 |
61.1 |
| Checking every time |
24 |
66.7 |
Table 1 shows over half of the students
approved the methods very much. This indicates
the effectiveness of the methods
5.2 Students' voluntariness of doing
oral tasks after class
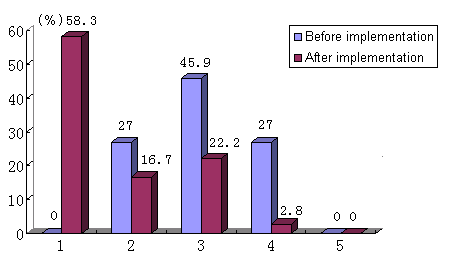
Graph 2: Comparison of whether the students
do oral tasks or not

Graph 2 shows that there is the greatest
improvement in this respect. After I implemented
the project, 58.3% of the students could
finish every oral practice I asked them
to do after class. If we add the percentage
of the students choosing 5 and 4 together
in Questionnaire Two, we may conclude
that 75% of the students can do oral tasks
on their own initiative and enthusiasm.
But I also learn that about 25% of them
sometimes did not do their oral homework.
This may be caused by both students and
me. Some of them did not study hard, some
are very weak in English, while others
might dislike my oral tasks. So I should
try my best to do my work better.
I think the improvement is mainly due
to these four factors: Firstly, providing
very effective help. Secondly, improving
the recited homework. Thirdly, practising
oral tasks with peers Fourthly, checking
their oral tasks every time.